
General System Location Data Explorer
A React workspace for geospatial analysis, replacing an existing Streamlit interface.
Overview
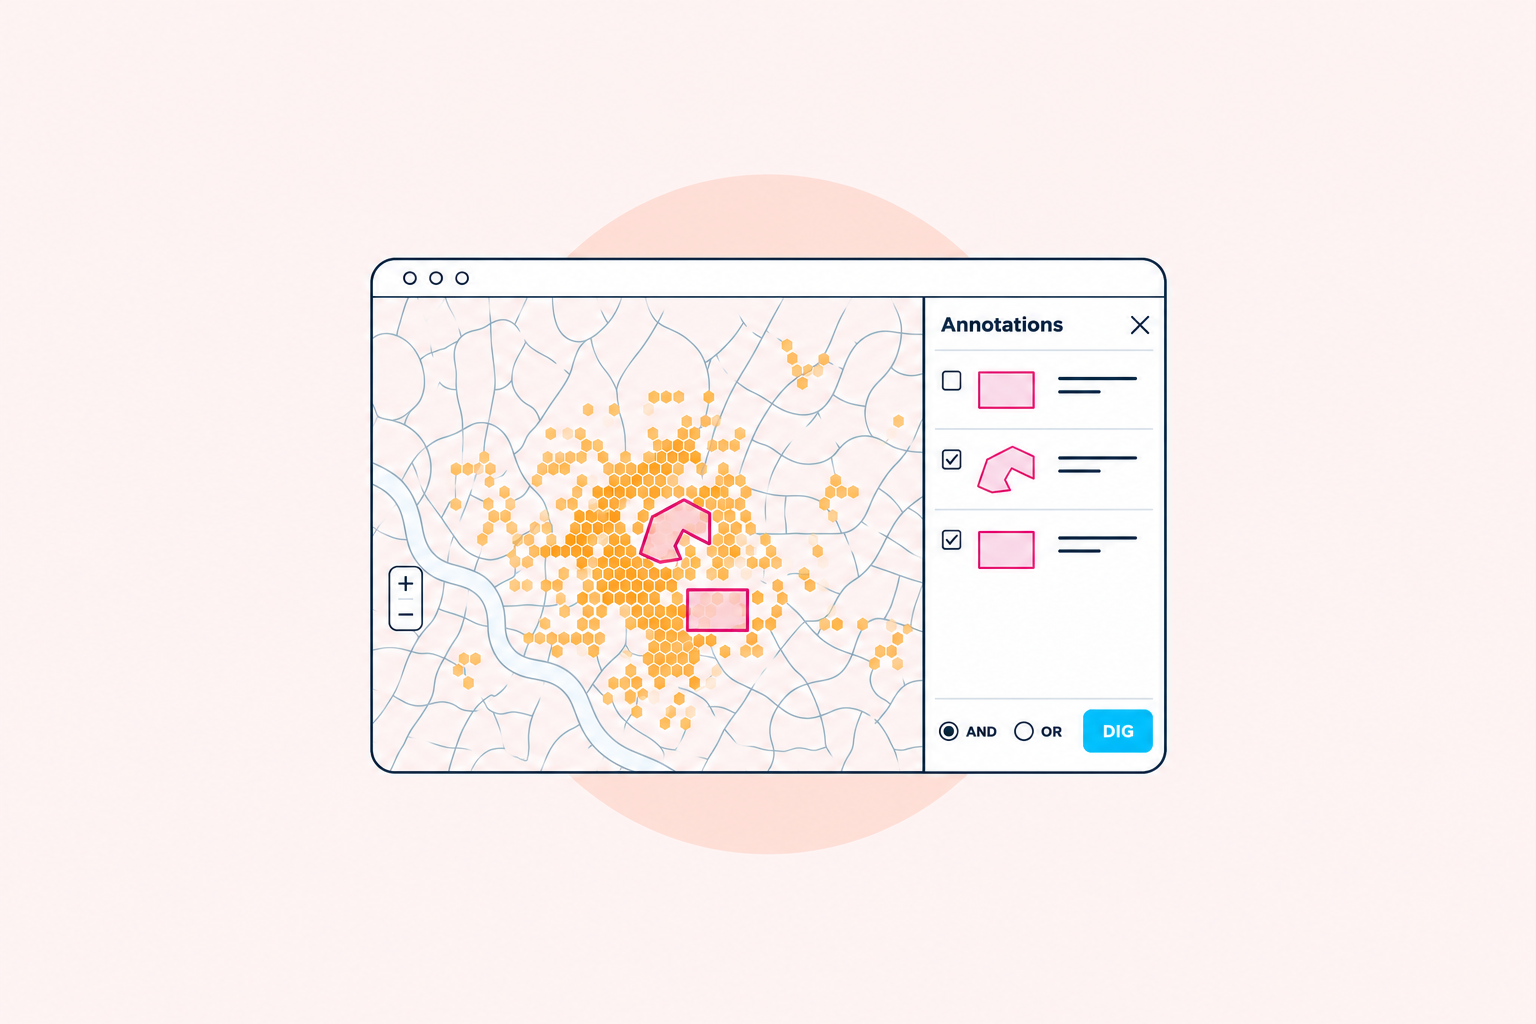
I rebuilt Insight, General System’s web interface for exploring location data, replacing an earlier Streamlit application with a React workspace for geospatial analysts. It brought map exploration, saved target areas, and device analysis into one interface.
The challenge
An analyst could begin with a place and time, find devices active in that area, and follow those devices to other locations. Each finding could lead to another question, so the interface needed to make it easy to save areas and carry them into further analysis.
The existing Streamlit application combined interface code with some data processing logic. The rebuild needed a clearer separation between the web interface and the existing analytical services, while supporting large batches of location data, secure access, and multiple users.
My contribution
I handled frontend development, working with the designer, backend engineer, and product manager. My responsibility was building the React interface and connecting the analyst workflow to the platform’s services.
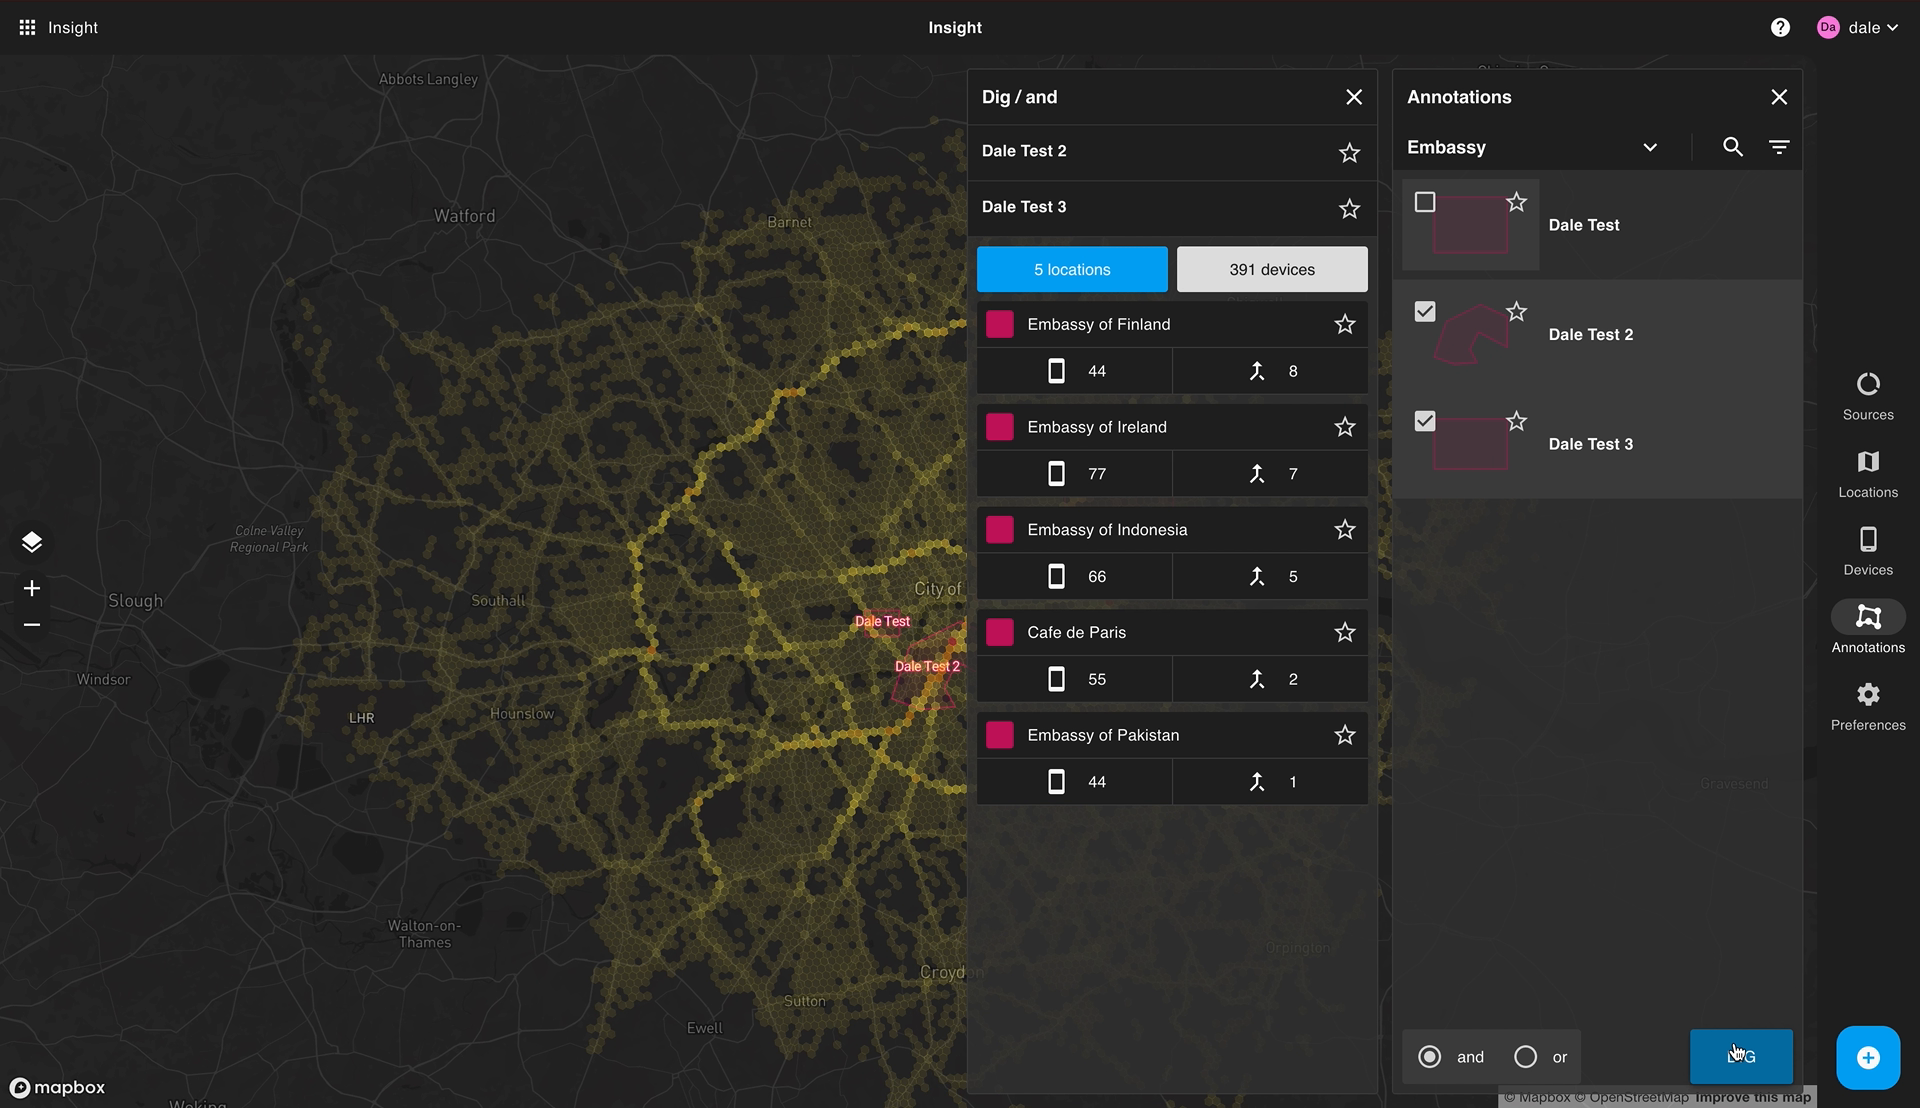
I built the map workspace around that sequence of questions. Analysts could explore data layers, draw and save target areas with a time range, discover matching devices, and investigate other locations those devices visited. Heatmaps showed concentrations of activity, helping analysts decide where to look next. Combining target areas with AND or OR let them narrow or broaden a search, then save an interesting location as another target area and continue.
The interface used the existing Target Area Service, a REST API backed by PostgreSQL and PostGIS that handled operations such as counting devices within a polygon. The analytics platform already precomputed H3 hexagon IDs and aggregations in PostGIS. Those hexagons reduced the number of features drawn on the map, giving the interface a practical way to display the spatial distribution of large datasets.
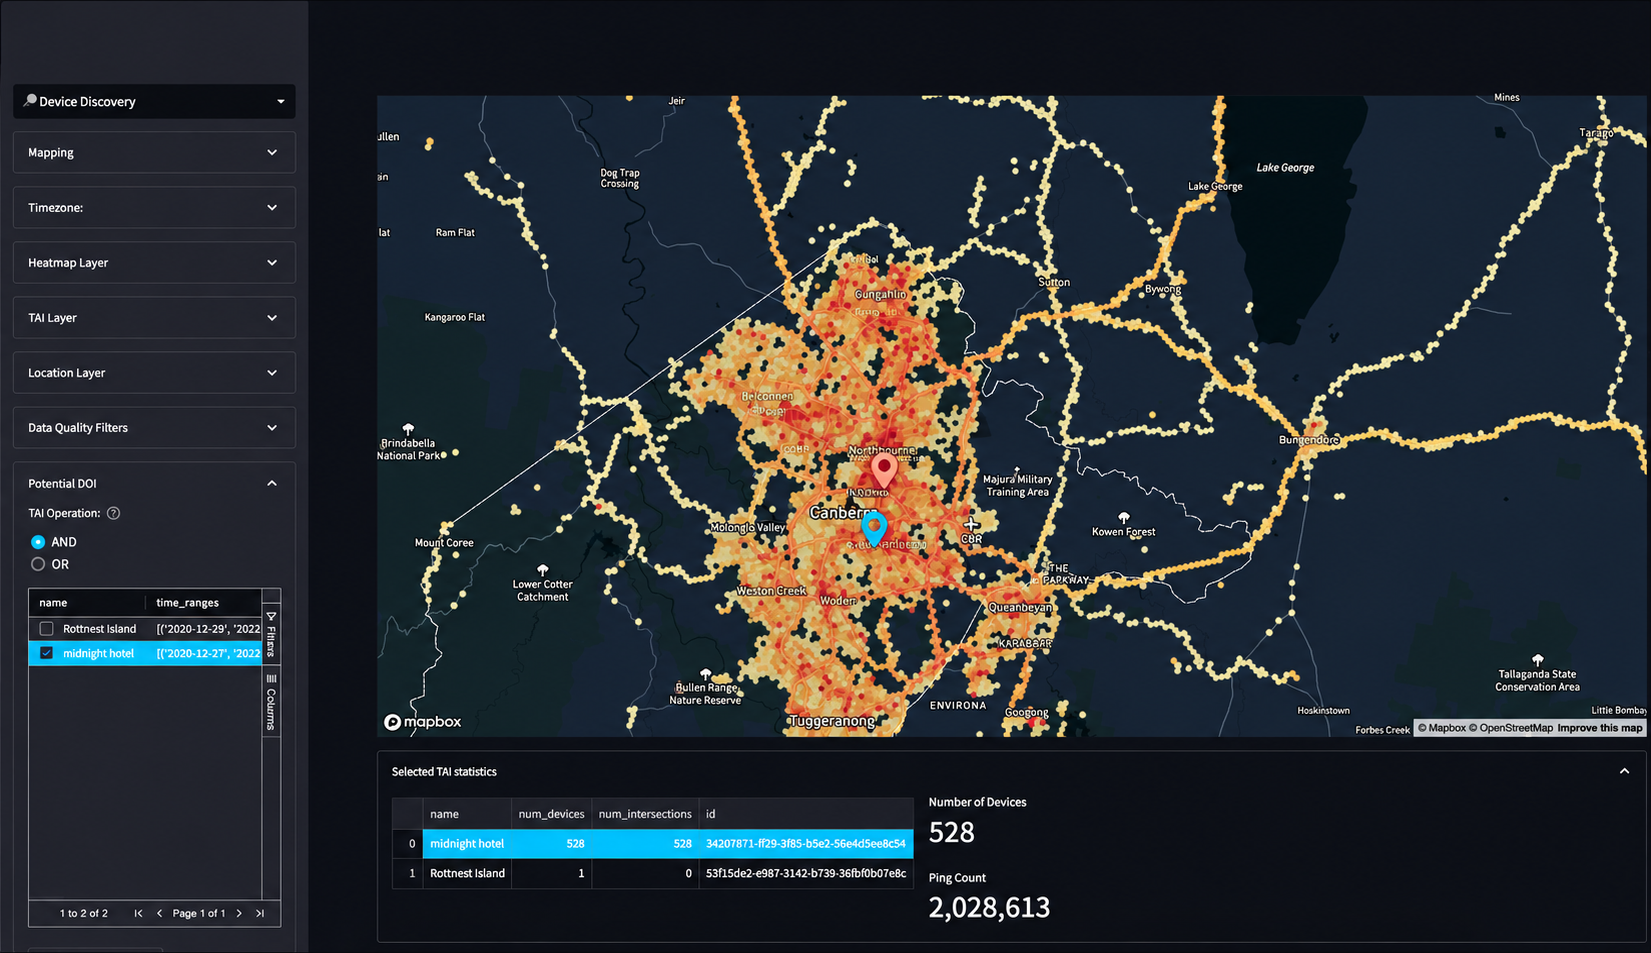
Before and after
The rebuilt workspace kept the map central, with panels for drawing annotations, selecting target areas, and reviewing matching locations and devices.
Outcome
The team delivered the replacement platform with secure access, support for multiple users, and large-scale batch data analysis. It expanded to include device pattern-of-life analysis and co-location patterns, showing how devices moved over time and where their activity overlapped.
Technologies
React, JavaScript, and AWS services, connecting to existing REST APIs backed by PostgreSQL and PostGIS.